Association of serum chemerin and inflammatory factors with type 2 diabetes macroangiopathy and waist-to-stature ratio

Authors

  • Mengxue Yang Department of Endocrinology, The Fifth People’s Hospital of Shanghai, Fudan University, Shanghai, China; Department of Endocrinology, Zunyi Medical University, Zunyi, China https://orcid.org/0000-0003-4189-4226
  • Xue Zhou Department of Endocrinology, Zunyi Medical University, Zunyi, China https://orcid.org/0000-0002-3810-0803
  • Jie Xu School of Public Health, Zunyi Medical University, Zunyi, China
  • Bo Yang Department of Endocrinology, Zunyi Medical University, Zunyi, China
  • Jie Yu School of Public Health, Zunyi Medical University, Zunyi, China
  • Qihai Gong Key Laboratory of Basic Pharmacology of Ministry of Education and Joint International Research Laboratory of Ethnomedicine of Ministry of Education, Zunyi Medical University, Zunyi, China
  • Xuan Zhang Department of Endocrinology, Zunyi Medical University, Zunyi, China
  • Xiaohua Sun Department of Endocrinology, Ningbo No. 2 Hospital, Ningbo, China
  • Qun Zhang Department of Endocrinology, Ningbo No. 2 Hospital, Ningbo, China
  • Jinying Xia Department of Endocrinology, Ningbo No. 2 Hospital, Ningbo, China
  • Jianhui Li Department of Endocrinology, Ningbo No. 2 Hospital, Ningbo, China

DOI:

https://doi.org/10.17305/bjbms.2019.4002

Keywords:

Type 2 diabetes, T2DM, macroangiopathy, chemerin, inflammatory factor, glycolipid metabolism

Abstract

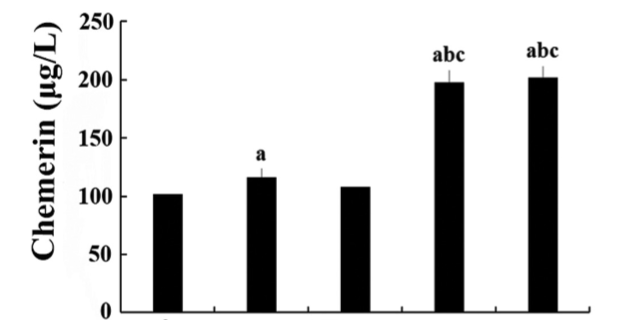
Chemerin is an adipocytokine that participates in glycolipid metabolism; however, its association with type 2 diabetes (T2DM) with lower extremity macroangiopathy (T2DM-V) has rarely been reported. This study explored the association of chemerin and inflammatory factors with body fat parameters, glucolipid metabolism, and insulin resistance (IR) in T2DM and T2DM-V. Patients were classified into normal glucose regulation (NGR), T2DM, and T2DM-V groups. Serum chemerin, glucolipid metabolic parameters, transforming growth factor (TGF)-β, interleukin (IL)-6, monocyte chemoattractant protein (MCP)-1, and fasting insulin levels were measured along with HOMA-IR, body mass index (BMI), and waist-to-stature ratio (WSR). Serum chemerin, TGF-β, IL-6, and MCP-1 levels were significantly higher in T2DM groups than in NGR group, and BMI, WSR, fasting plasma glucose (FPG), 2hPG, glycated hemoglobin (HbA1c), triglycerides (TG), and HOMA-IR were higher in T2DM-V subgroups with moderate or severe lower extremity macroangiopathy than in NGR group, simple T2DM group, and T2DM-V subgroup with mild macroangiopathy. FPG, 2hPG, HbA1c, TG, and HOMA-IR were higher in T2DM-V subgroup with severe macroangiopathy than in T2DM-V with moderate macroangiopathy (p < 0.05). In all groups, serum chemerin levels were positively correlated with BMI, WSR, FPG, 2hPG, HbA1c, fasting insulin, aspartate transaminase, TG, TGF-β, IL-6, and HOMA-IR (p < 0.05) and negatively correlated with high-density lipoprotein cholesterol [HDL-c] (p < 0.05). Multiple stepwise regression analysis showed that 2hPG, HbA1c, and HDL-c were independent predictors of serum chemerin levels (β = -0.768, -0.122, -0.115, and 3.261, respectively; p < 0.01). Collectively, chemerin, factors associated with obesity, pathological and physiological changes in glucolipid metabolism, and inflammatory factors may promote the development of T2DM macroangiopathy.

Downloads

Download data is not yet available.
Association of serum chemerin and inflammatory factors with type 2 diabetes macroangiopathy and waist-to-stature ratio

Downloads

Additional Files

Published

2019-11-08

How to Cite

1.
Yang M, Zhou X, Xu J, Yang B, Yu J, Gong Q, Zhang X, Sun X, Zhang Q, Xia J, Li J. Association of serum chemerin and inflammatory factors with type 2 diabetes macroangiopathy and waist-to-stature ratio. Biomol Biomed [Internet]. 2019Nov.8 [cited 2023Mar.29];19(4):328-35. Available from: https://bjbms.org/ojs/index.php/bjbms/article/view/4002

Issue

Section

Biochemistry

INTRODUCTION

The complications of diabetes mellitus can be categorized as macrovascular and microvascular, with the former including coronary artery disease, cerebrovascular disease, and peripheral vascular disease. Macrovascular complications are closely associated with type 2 diabetes mellitus (T2DM) and are a primary cause of death and disability among T2DM patients. Notably, atherosclerosis is the pathological process underlying macrovascular complications. Numerous studies have shown that patients with T2DM and atherosclerosis have chronic, mild, subclinical inflammation and that this inflammation plays an important role in the development of atherosclerosis and other complications in T2DM patients [1,2].

To date, it is widely accepted that the development of T2DM macroangiopathy is caused by chronic inflammatory reactions, and a variety of inflammatory factors participate in this process [3]. In addition, adipose tissue secretes adipocytokines, such as leptin and adiponectin, and these factors play an important role in energy balance and metabolic regulation, as well as in immunoregulation and vascular homeostasis. Thus, the role of adipocytokines in the development of vascular disease has attracted considerable attention of the research community [3].

Chemerin, a recently discovered adipocytokine so named because of its ability to stimulate chemotaxis of leukocytes, is a secretory protein with multiple biological effects. Chemerin stimulates antigen-presenting cells, promoting the release of proinflammatory factors, such as interleukin (IL)-1β, IL-6, IL-8, and tumor necrosis factor (TNF)-α; in combination with its receptor, chemerin regulates the expression of inflammatory factors via multiple signaling pathways, resulting in a cascade of inflammatory reactions [4]. Chemerin is also strongly related to various components of metabolic syndrome that are associated with dysregulated angiogenesis [5,6]. Furthermore, chemerin mediates the formation of blood vessels significantly, similarly to vascular endothelial growth factor (VEGF) as shown by functional angiogenesis assays in human endothelial cells [7]. Increases in the plasma levels of chemerin and VEGF are positively correlated with the ankle-brachial index in diabetic peripheral vascular disease. These findings indicate the angiogenic effect of chemerin and VEGF on peripheral blood flow improvements in patients with diabetic peripheral vascular disease [5]. Furthermore, chemerin is known to be involved in glucolipid metabolism. Many studies on chemerin have indicated that this adipocytokine has several functions, as its receptors are distributed throughout the body [8,9]. In addition, chemerin has been related to obesity and several components of metabolic syndrome. Studies have indicated that it may be related to immune-mediated inflammatory disease, high blood pressure, and vascular endothelial function [7,10,11]. Interestingly, Weigert et al. suggested that in patients with T2DM, serum chemerin levels were related to inflammation but not obesity [12]. However, to our knowledge, studies in humans examining the association between T2DM macroangiopathy and chemerin are lacking. Perumalsamy et al. [13] reported that a high chemerin level in humans is considered a marker of insulin resistance (IR) and insulin storage, as well as of T2DM. Chemerin plays a role in both inflammation and metabolism and may provide a link between chronic inflammation and obesity and its related disorders. Chemerin was positively correlated with inflammatory markers, and a positive association between baseline chemerin and high-sensitivity C-reactive protein (hs-CRP) levels suggests that serum chemerin is associated with inflammation in type 2 diabetic patients [14]. Thus, the research focusing on this adipocytokine is important.

The present study examined serum chemerin levels in T2DM patients with and without lower extremity macroangiopathy to analyze the correlation between these levels and body fat, glucolipid metabolism, and IR. The results of this study may shed a new light on the early diagnosis and treatment of T2DM macroangiopathy.

MATERIALS AND METHODS

Patients

Between September 2012 and October 2014, untreated T2DM patients were recruited from the Affiliated Hospital of Zunyi Medical College, and they underwent an oral glucose tolerance test (OGTT) with 75 g of glucose. The experiment included 80 patients: 43 men and 37 women (median age, 53 ± 17 years). The T2DM diagnosis was consistent with the 1999 diabetes diagnostic and classification criteria of the World Health Organization (WHO). Patients with the following conditions were excluded: 1) a medical history of diabetes or hypoglycemic agent therapy; 2) type-1 diabetes, gestational diabetes, or specific types of diabetes; 3) acute complications of diabetes (e.g., diabetic ketoacidosis, hyperosmolar hyperglycemic state, and lactic acidosis); 4) serious infection and stress response; 5) severe hepatic and renal dysfunction; 6) malignant tumors, connective tissue diseases, coronary heart disease, and cerebral apoplexy; or 7) use of drugs that would affect the experiment (e.g., contraceptive drugs, statins, etc.).

Twenty healthy volunteers who underwent physical examination during the same period were matched, and they constituted healthy control group (normal glucose regulation [NGR] group; male:female 12:8; median age 46 ± 12 years).

All recruited participants were of Han ethnicity, and none were related to each other. All participants provided written informed consent to participate in this study, which was approved by the ethics committee of Zunyi Medical University (approval no. (2012) 1-106).

Grouping

A cutting-edge color Doppler analyzer (HP Sonos 5500; Agilent, Palo Alto, CA, US) was used to examine the lower extremity arteries (femoral, popliteal, anterior tibial, posterior tibial, and dorsalis pedis arteries) of the patients. Based on the presence of lower extremity macroangiopathy, patients were subdivided into T2DM group (simple T2DM; male:female = 27:23; n = 50) and T2DM + macroangiopathy group (T2DM-V; male:female = 15:15; n = 30). Any detected lower extremity macroangiopathy was classified as 1 of 4 types depending on its properties (endarterial thickness, arteriosclerosis, plaques, and arterial stenosis) and scored as follows [15]: 0, normal condition; 1, mild condition; 2, moderate condition; and 3, diffusive plaques and vascular occlusion. The maximum score was 20. The total scores were used to assess the lesions and create patient subgroups. For simple T2DM group, the ultrasound examination showed normal blood vessels in the lower extremity, and the score was 0. For T2DM-V group, 3 subgroups were formed with 13 cases in the subgroup with mild condition (scores 1–9; 7 men and 6 women), 10 cases in the subgroup with moderate condition (scores 10–19; 6 men and 4 women), and 7 cases in the subgroup with severe condition (score 20; 3 men and 4 women).

Observational indices

General data collection

Data concerning age and previous medical history regarding diseases, drugs, and smoking were collected for all participants.

Body fat parameters

Total body fat was measured with body mass index (BMI) as the indicator. First, height and weight were measured. For height measurement, the patient was asked to stand barefoot in an upright posture on the base of the height gauge, with the upper limbs hanging naturally, heels close together, toes separated by an approximately 60° angle, and heels, sacrum, and both shoulder blades closely in line with the column. Weight was measured with participants wearing light clothing, standing in the center of the device, and ensuring that their body did not touch surrounding objects. Then, BMI was calculated using a standardized formula (BMI = weight/height2 [kg/m2]).

Local body fat parameters were measured, including waistline, height, and the midpoint of the ligature of the anterior superior spine and the lower edge of the 12th rib. The vertical distance from the top of the head to the heels was measured, and the waist-to-stature ratio (WSR = waist/height) was calculated; a ratio ≥0.5 was considered to indicate a risk of T2DM and hypertension [16].

Blood parameters

To measure blood parameters, the blood was extracted under fasting conditions. Serum was separated to measure the levels of chemerin (enzyme-linked immunosorbent assay [ELISA]; R&D Systems, US; within-lot coefficient of variation [CV] <7.8% and inter-lot CV <9.8%), TGF-β, IL-6, and monocyte chemoattractant protein-1 [MCP-1] (all using ELISA; Biosource, US). We also measured fasting plasma glucose (FPG) levels (using the glucose oxidase method), blood lipid levels, hepatic and renal function (automatic biochemical analyzer), glycated hemoglobin [HbA1c] (high-pressure liquid chromatography method), and fasting insulin levels (chemiluminescence). Two hours after the OGTT, blood was collected to measure the 2-h plasma glucose (2hPG) levels. Homeostasis model assessment (HOMA) was used to examine the IR index (HOMA-IR = Upflashing insulin/22.5).

Statistical analysis

Measurement data are presented as the mean ± standard deviation. A t-test was used to compare measurement data between two groups, while one-way analysis of variance (ANOVA) was used to compare measurement data among the NGR group, simple T2DM group, and T2DM-V subgroups. Pearson correlation coefficient was used for correlation analysis, and multiple stepwise regression analysis was used for multifactorial analysis. SPSS for Windows, Version 13.0. (SPSS Inc., Chicago, US) was used for all statistical analyses, and p < 0.05 was considered to indicate significant differences.

RESULTS

General data analysis

The general data of NGR and T2DM groups are summarized in Table 1. No significant differences in gender ratios or age were observed between the groups.

TABLE 1: Comparison of clinical parameters between NGR and T2DM group

Comparison of body fat parameters, glucolipid metabolism, and CRP levels between NGR and T2DM groups

WSR, HOMA-IR, and the levels of FPG, 2hPG, HbA1c, blood uric acid (UA), fasting insulin, triglycerides (TG), total cholesterol (TC), and gamma-glutamyltransferase (GGT) were significantly higher in T2DM groups than in NGR group (p < 0.05). However, no significant differences were found in gender distribution, age, BMI, blood pressure, levels of urea, creatinine (Cr), high-density lipoprotein cholesterol (HDL-c), and low-density lipoprotein cholesterol [LDL-c] between the groups (p > 0.05; Table 1).

Comparison of body fat parameters and glucolipid metabolism among the three T2DM-V subgroups and the remaining groups

BMI, WSR, HOMA-IR, and the levels of FPG, 2hPG, HbA1c, and TG were significantly higher in T2DM-V subgroups with moderate and severe condition than in NGR group, simple T2DM group, and T2DM-V subgroup with mild condition (p < 0.05). Further, the levels of FPG, 2hPG, HbA1c, and TG and HOMA-IR were significantly higher in T2DM-V subgroup with severe condition than in the subgroup with moderate condition (p < 0.05). No significant differences were found in other glucolipid metabolism parameters among the NGR group, simple T2DM group, and T2DM-V subgroup with mild macroangiopathy (p > 0.05; Table 2).

TABLE 2: Comparison of clinical parameters among study groups

Serum chemerin analysis

After adjustment for BMI and WSR, the serum chemerin level was found to be higher in T2DM groups than in NGR group (Figure 1).

FIGURE 1: Comparison of serum chemerin levels among groups with different levels of glucose regulation, BMI, and WSR. NGR: Normal glucose regulation, T2DM: Type 2 diabetes mellitus, WSR: Waist-to-stature ratio=waist/height. a, p < 0.05 vs. NGR; b, p < 0.05 vs. WSR ≤ 0.55.

For subsequent analysis of serum chemerin levels, T2DM patients were classified into WSR ≤ 0.55 group and WSR > 0.55 group. Serum chemerin levels were significantly higher in the second compared with the first WSR group (198 ± 58 vs. 108 ± 39 µg/L; p < 0.05).

Serum chemerin levels in T2DM-V patients were 108 ± 46 µg/L in the subgroup with mild condition, 198 ± 36 µg/L in the subgroup with moderate condition, and 202 ± 86 µg/L in the subgroup with severe condition. Thus, serum chemerin levels were significantly higher in the latter 2 subgroups than in the subgroup with mild condition (p < 0.05). However, the difference in serum chemerin levels between T2DM-V subgroups with moderate and severe condition was not significant (p > 0.05). Compared with simple T2DM (116 ± 48 µg/L) and NGR group (102 ± 39 µg/L), T2DM-V subgroups with moderate and severe condition had significantly higher serum chemerin levels (p < 0.05 for both; Figure 2).

FIGURE 2: Comparison of serum chemerin levels among subgroups of T2DM patients with lower extremity macroangiopathy. NGR: Normal glucose regulation, T2DM-AO: Type 2 diabetes mellitus alone, T2DM-V(Mi): Type 2 diabetes mellitus vascular diseases (mild), T2DM-V(Mo): Type 2 diabetes mellitus vascular diseases (moderate), T2DM-V(Se): Type 2 diabetes mellitus vascular diseases (severe). a, p < 0.05 vs. NGR; b, p < 0.05 vs. T2DM-AO; c, p < 0.05 vs. T2DM-V(Mi).

Comparison of serum TGF-β, IL-6, and MCP-1 levels among the groups

Serum TGF-β concentrations were higher in T2DM-V (13.6 ± 3.8 ng/ml) than in simple T2DM (10.9 ± 3.1 ng/ml) or NGR group (10.5 ± 4.1 ng/ml), and the differences were statistically significant (p < 0.05). However, there was no significant difference in serum TGF-β concentration between simple T2DM and NGR group (p > 0.05; Table 3). Serum IL-6 and MCP-1 concentrations in T2DM-V group (IL-6 31.2 ± 3.5 pg/ml; MCP-1 36.8 ± 6.7 pg/ml) were higher than in simple T2DM (IL-6 22.7 ± 6.1 pg/ml; MCP-1 20.4 ± 9.5 pg/ml) and NGR (IL-6 11.5 ± 3.5 pg/ml; MCP-1 19.6 ± 9.2 pg/ml) groups. These differences were statistically significant (p < 0.05), and the serum IL-6 concentration was also significantly higher in simple T2DM than in NGR group (p < 0.05). However, there was no significant difference in MCP-1 levels between those two groups (p > 0.05; Table 3).

TABLE 3: Serum TGF-β, IL-6, and MCP-1 levels of study groups

Outcomes of correlation analysis

A positive correlation was found between serum chemerin levels and BMI, WSR, and the levels of FPG, 2hPG, HbA1c, fasting insulin, aspartate transaminase (AST), TG, TGF-β, IL-6, and HOMA-IR (γ = 0.386, 0.393, 0.298, 0.388, 0.387, 0.198, 0.192, 0.175, 0.308, 0.326, and 0.391, respectively; all p < 0.05). Serum chemerin levels were negatively correlated with HDL-c levels (γ = -0.386, p < 0.05). In the stepwise regression analysis, serum chemerin levels were considered the dependent variable, and BMI, WSR, HOMA-IR, systolic and diastolic blood pressure, and the levels of FPG, 2hPG, HbA1c, fasting insulin, AST, alanine aminotransferase (ALT), GGT, TG, TC, LDL-c, HDL-c, blood urea nitrogen, serum Cr, and UA were considered independent variables. The levels of BMI, WSR, 2hPG, HbA1c, and HDL-c were found to be independently associated with serum chemerin levels (all p < 0.05; Table 4).

TABLE 4: Outcomes of logistic regression analysis using serum chemerin as the dependent variable

DISCUSSION

Numerous studies have reported a close correlation between adipocytokines (such as leptin, adiponectin, visfatin, and apelin) and the incidence of T2DM and IR [17-19]. Chemerin is a newly identified adipocytokine, and recent cell, animal, and clinical studies have shown that serum chemerin levels are correlated with obesity, diabetes, IR, and metabolic syndrome [8,11,20,21]. Therefore, the present study discussed the possible role of chemerin in the development of obesity and T2DM macroangiopathy and examined the correlation between chemerin and body fat parameters, glucolipid metabolism, and IR. To this end, we measured serum chemerin levels in patients with T2DM macroangiopathy and compared with those of a healthy control group. Additionally, we simultaneously determined the correlation between serum chemerin levels and other metabolic and biochemical indices.

Chemerin may participate in the occurrence and development of T2DM macroangiopathy through the following pathways: 1) promoting the occurrence of IR and maintenance of long-term high blood glucose levels in the body. Hyperglycemia was shown to cause increased free radical production, increased oxidative stress and dysfunction of endothelial cells, all of which aggravate diabetic vascular damage [8,22]; 2) participating in the immune and inflammatory response by promoting differentiation of adipocytes and affecting lipid metabolism, as well as participating in the progression of diabetic macroangiopathy [23]; 3) affecting vascular remodeling, proliferation, and migration and regulation of blood pressure, along with promoting the occurrence and development of diabetic macroangiopathy [24]; and 4) causing atherosclerosis by inducing dysfunction in the vascular endothelium [25].

This study showed that the serum levels of inflammatory cytokines (TGF-β, IL-6, and MCP-1) were higher in T2DM-V groups than in simple T2DM and NGR groups. The correlation analysis also found that serum chemerin levels are positively correlated with TGF-β and IL-6, suggesting that inflammatory factors may also promote the development of T2DM macroangiopathy. Indeed, IL-6 and other inflammatory factors enhance the adhesion of monocytes to vascular endothelial cells, impair endothelial cells, enhance the permeability of blood vessels, and accumulate the extracellular matrix. This activity is caused by damage to endothelial cells, which agglutinates platelets; moreover, MCP-1 increases the adhesion of monocytes to vascular endothelial cells and is likely to develop towards the intima, resulting in the formation of atherosclerotic plaques with the involvement of macrophages. Parlee et al. found that chemerin can stimulate the chemotaxis of mononuclear macrophages and dendritic lymphocytes, causing them to accumulate across the vascular endothelium to sites of inflammation [26]. This accumulation allows mononuclear macrophages to increase cholesterol uptake and promote the transformation of macrophages to foam cells, simultaneously releasing various inflammatory factors such as TNF-α and IL-6 and further expanding the inflammatory response through positive feedback mechanisms [26].

According to our findings, serum chemerin levels and HOMA-IR were 102 ± 39 µg/L and 0.8 ± 0.5, respectively in NGR group and 116 ± 48 µg/L and 2.3 ± 1.0, respectively in simple T2DM group. In T2DM-V patients, serum chemerin levels and HOMA-IR were 108 ± 46 µg/L and 3.0 ± 1.1, respectively in the subgroup with mild condition, 198 ± 36 µg/L and 2.8 ± 1.9, respectively in the subgroup with moderate condition, and 202 ± 86 µg/L and 3.5 ± 2.8, respectively in the subgroup with severe condition. Thus, we showed that serum chemerin levels and HOMA-IR were significantly higher in the subgroup with severe T2DM macroangiopathy compared with other groups, indicating a correlation of serum chemerin levels with obesity, T2DM macroangiopathy, and the development of IR. These findings contradict those of Weigert et al. [12], which indicate that the chemerin level might be associated with inflammation rather than obesity in T2DM patients. The reasons for this discrepancy may be different regions of origin of the examined patients and differences in the experimental objectives between our and the Weigert study.

The present study also found that as the severity of lower extremity macroangiopathy increased, the serum chemerin levels increased, indicating a possible correlation between these levels and T2DM macroangiopathy severity. However, no obvious differences in serum chemerin levels were observed between T2DM-V subgroups with moderate and severe condition. The reasons for this discrepancy could be that the number of patients was small and that the differences in lower extremity macroangiopathy severity were not obvious. A positive correlation was found between serum chemerin levels and BMI and WSR, indicating that chemerin levels might be related to obesity and body fat distribution; this finding is consistent with those of Yang et al. [11]. Further, our study found that serum chemerin levels were significantly higher in WSR > 0.55 group compared with WSR ≤ 0.55 group, suggesting also that serum chemerin levels are related to obesity, which is again consistent with the previous research [27]. Finally, BMI and WSR were higher in T2DM-V subgroups with moderate or severe lower extremity macroangiopathy compared with simple T2DM group and mild T2DM-V subgroup, indicating that obesity and body fat distribution might be related to lower extremity macroangiopathy in T2DM patients.

Hatziagelaki et al. found that chemerin levels associate positively with β-cell function during fasting and under dynamic conditions as assessed with the insulinogenic index IGI_cp and the adaptation index [28]. Thus, collectively, the results suggest that chemerin may be one of the adipocytokines that regulate the function of pancreatic β-cells. However, further studies are needed to confirm this hypothesis. Furthermore, the regression analysis of all groups in this study indicated that the serum chemerin level was a dependent variable and that systolic and diastolic blood pressure and blood biochemical indices (i.e., levels of FPG, 2hPG, HbA1c, fasting insulin, AST, ALT, GGT, TG, TC, LDL-c, HDL-c, blood urea nitrogen, serum Cr, and UA) were independent variables. The levels of BMI, WSR, 2hPG, HbA1c, and HDL-c were found to be independently associated with serum chemerin levels.

CONCLUSION

In conclusion, chemerin together with the factors associated with obesity, pathological and physiological changes in glucolipid metabolism, and inflammatory factors may promote the development of T2DM macroangiopathy. However, the specific mechanism is not clear and needs to be further verified in cell and animal experiments.

Acknowledgements

ACKNOWLEDGMENTS

This study was supported by the National Natural Science Foundation of China (number 81560147), the Science and Technology Support Program of Guizhou Province [contract number: Qian Ke He [2017] 2884, the Key Science and Technology Program of Guizhou Province [contract number: Qian Ke He SY (2012) 3116], the Science and Technology Research Foundation of Guizhou Province, China [contract number: Qian Ke He J LKZ (2013) 53], and the Doctoral Start-up Fund of Zunyi Medical University (project number F-588). Part of the work was done in the Key Laboratory of Basic Pharmacology of Ministry of Education and Joint International Research Laboratory of Ethnomedicine of Ministry of Education in Zunyi Medical University.

DECLARATION OF INTERESTS

The authors declare no conflict of interests.

REFERENCES

  1. (). Endothelial loss and repair in the vascular complications of diabetes:Pathogenetic mechanisms and therapeutic implications. Circ J. https://doi.org/10.1253/circj.CJ-13-0236
  2. , , , , , (). Role of endothelial cell-derived angptl2 in vascular inflammation leading to endothelial dysfunction and atherosclerosis progression. Arterioscler Thromb Vasc Biol. https://doi.org/10.1161/ATVBAHA.113.303116
  3. , , , , , (). Chemerin a new adipokine that modulates adipogenesis via its own receptor. Biochem Biophys Res Commun. https://doi.org/10.1016/j.bbrc.2007.08.104
  4. , , , , , (). Human articular chondrocytes express chemR23 and chemerin;chemR23 promotes inflammatory signalling upon binding the ligand chemerin(21-157). Arthritis Res Ther. https://doi.org/10.1186/ar3215
  5. (). Correlation of peripheral arterial blood flow with plasma chemerin and VEGF in diabetic peripheral vascular disease. Biomark Med. https://doi.org/10.2217/bmm.11.85
  6. , , , , (). Identification of chemerin receptor (ChemR23) in human endothelial cells:Chemerin-induced endothelial angiogenesis. Biochem Biophys Res Commun. https://doi.org/10.1016/j.bbrc.2009.12.150
  7. , , , , , (). Chemerin, a novel adipokine in the regulation of angiogenesis. J Clin Endocrinol Metab. https://doi.org/10.1210/jc.2010-0042
  8. , , , , , (). Chemerin is a novel adipokine associated with obesity and metabolic syndrome. Endocrinology. https://doi.org/10.1210/en.2007-0175
  9. , , , , , (). Circulating levels of chemerin and adiponectin are higher in ulcerative colitis and chemerin is elevated in Crohn's disease. Inflamm Bowel Dis. https://doi.org/10.1002/ibd.21091
  10. , , , , , (). Mouse chemR23 is expressed in dendritic cell subsets and macrophages, and mediates an anti-inflammatory activity of chemerin in a lung disease model. J Immunol. https://doi.org/10.4049/jimmunol.0901037
  11. , , , , , (). Elevated plasma levels of chemerin in newly diagnosed Type 2 diabetes mellitus with hypertension. J Investig Med. https://doi.org/10.2310/JIM.0b013e3181ec5db2
  12. , , , , , (). Systemic chemerin is related to inflammation rather than obesity in Type 2 diabetes. Clin Endocrinol (Oxf). https://doi.org/10.1111/j.1365-2265.2009.03664.x
  13. , , , , , (). Chemokine like receptor-1 (CMKLR-1) receptor:A potential therapeutic target in management of chemerin induced Type 2 diabetes mellitus and cancer. Curr Pharm Des. https://doi.org/10.2174/1381612823666170616081256
  14. , , , , , (). Effect of lifestyle modification on serum chemerin concentration and its association with insulin sensitivity in overweight and obese adults with Type 2 diabetes. Clin Endocrinol (Oxf). https://doi.org/10.1111/cen.12249
  15. , , (). The prevalence of vascular lesions in the lower extremities and their risk factors in Type 2 diabetic mellitus. Chin J Diabetes.
  16. (). Waist/height ratio:An effective index for abdominal obesity predicting diabetes and hypertension. Chin J Endocrinol Metab.
  17. , (). Clinical applications of adiponectin measurements in Type 2 diabetes mellitus:Screening, diagnosis, and marker of diabetes control. Dis Markers. https://doi.org/10.1155/2018/5187940
  18. , , (). Assessment of salivary adipokines resistin, visfatin, and ghrelin as Type 2 diabetes mellitus biomarkers. Biochem Res Int 2018. 7463796https://doi.org/10.1155/2018/7463796
  19. , , , , , (). Association between FTO gene polymorphisms and Type 2 diabetes mellitus, serum levels of apelin and androgen hormones among Iranian obese women. Gene. https://doi.org/10.1016/j.gene.2017.10.082
  20. , , , , , (). Chemerin is associated with markers of inflammation and components of the metabolic syndrome but does not predict coronary atherosclerosis. Eur J Endocrinol. https://doi.org/10.1530/EJE-09-0380
  21. , , , (). Chemerin exacerbates glucose intolerance in mouse models of obesity and diabetes. Endocrinology. https://doi.org/10.1210/en.2009-1098
  22. , , (). Association between serum chemerin concentrations and clinical indices in obesity or metabolic syndrome:A meta-analysis. PLoS One. https://doi.org/10.1371/journal.pone.0113915
  23. , , (). Role of chemerin/CMKLR1 signaling in adipogenesis and osteoblastogenesis of bone marrow stem cells. J Bone Miner Res. https://doi.org/10.1359/jbmr.091106
  24. , , (). Chemerin as an independent predictor of cardiovascular event risk. Ther Adv Endocrinol Metab. https://doi.org/10.1177/2042018816629894
  25. , , , , , (). Expression, regulation, and function of atypical chemerin receptor CCRL2 on endothelial cells. J Immunol. https://doi.org/10.4049/jimmunol.1102871
  26. , , , , (). Serum chemerin levels vary with time of day and are modified by obesity and tumor necrosis factor-{alpha}. Endocrinology. https://doi.org/10.1210/en.2009-0794
  27. , , , , , (). Salivary, gingival crevicular fluid and serum levels of ghrelin and chemerin in patients with periodontitis and overweight. J Periodontal Res. https://doi.org/10.1111/jre.12476
  28. , , , , , (). Serum chemerin concentrations associate with beta-cell function, but not with insulin resistance in individuals with non-alcoholic fatty liver disease (NAFLD). PLoS One. https://doi.org/10.1371/journal.pone.0124935