Diagnostic accuracy of two-dimensional shear wave elastography and point shear wave elastography in identifying different stages of liver fibrosis in patients with metabolic dysfunction-associated steatotic liver disease: A meta-analysis
DOI:
https://doi.org/10.17305/bb.2024.11577Keywords:
Two-dimensional shear wave elastography, 2-D SWE, point shear wave elastography, pSWE, metabolic dysfunction-associated steatotic liver disease, MASLD, liver fibrosisAbstract
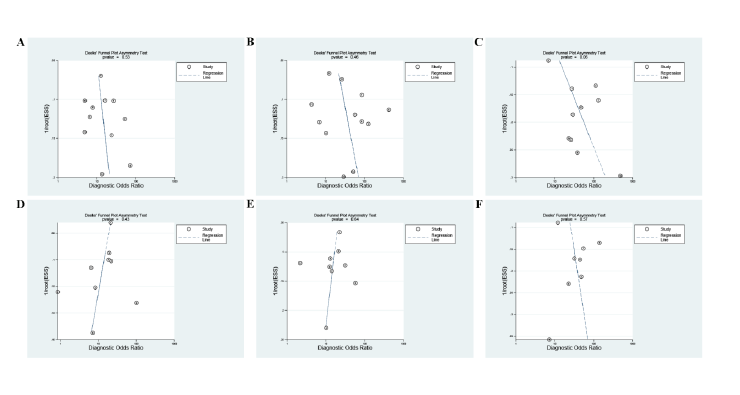
To assess the diagnostic accuracy of two-dimensional shear wave elastography (2-D SWE) and point shear wave elastography (pSWE) in detecting liver fibrosis stages in patients with metabolic dysfunction-associated steatotic liver disease (MASLD), a comprehensive search was conducted across four databases up to February 9, 2024. A bivariate random-effects model was used to analyze the diagnostic accuracy of the methods. After screening, 13 studies involving pSWE included 1527 patients, while nine studies involving 2-D SWE included 1088 patients. The areas under the summary receiver operating characteristic (SROC) curves for diagnosing significant fibrosis (F ≥ 2), advanced fibrosis (F ≥ 3), and cirrhosis (F = 4) using pSWE and 2-D SWE were as follows: 0.84 (95% CI 0.80–0.87), 0.91 (95% CI 0.88–0.93), and 0.94 (95% CI 0.91–0.95) for pSWE; 0.83 (95% CI 0.79–0.86) 0.85 (95% CI 0.82–0.88), and 0.89 (95% CI 0.86–0.91) for 2-D SWE, respectively. The pooled sensitivity for pSWE and 2-D SWE for stages F ≥ 2, F ≥ 3, and F = 4 were 0.71 (95% CI 0.63–0.78), 0.81 (95% CI 0.72–0.88), and 0.81 (95% CI 0.63–0.91) for pSWE, and 0.77 (95% CI 0.68–0.84), 0.80 (95% CI 0.72–0.87), and 0.92 (95% CI 0.75–0.98) for 2-D SWE, respectively. The pooled specificity of pSWE and 2-D SWE for these stages were 0.83 (95% CI 0.76–0.88), 0.87 (95% Cl: 0.81–0.92), and 0.91 (95% CI 0.86–0.94) for pSWE, and 0.76 (95% CI 0.66–0.84), 0.76 (95% CI 0.69–0.82), and 0.83 (95% CI 0.78–0.85) for 2-D SWE, respectively. In conclusion, both 2-D SWE and pSWE demonstrated high diagnostic performance in identifying various stages of liver fibrosis in MASLD patients.
Citations
Downloads
Downloads
Additional Files
Published
Issue
Section
Categories
License
Copyright (c) 2025 Xiangyi Xu, Yiqing Zhang, Qiwei Zhu, Yuchen Xie, Yuanyuan Zhou, Bingtian Dong, Chaoxue Zhang

This work is licensed under a Creative Commons Attribution 4.0 International License.